Part 2: Developing NOMAD plugins
Modifying an existing plugin
Follow the steps above about adding a plugin to your local NOMAD Development Distribution. You can open the files you want to modify in packages/<path_to_your_plugin
Let's open packages/pdi-nomad-plugin/src/pdi_nomad_plugin/mbe/processes.py and modify it.
Go to the ExperimentMbePDI class and let's add an additional quantity in the root section of this class just before the normalizer function def normalize:
my_quantity = Quantity(
        type=str,
        description='Just testing to modify a plugin',
        a_eln=ELNAnnotation(
            component='StringEditQuantity',
        ),
    )
Now we have to restart the NOMAD app worker in case it is running already. Therefore press CTRL + C in the terminal window where this process is running. Start the NOMAD app again by running uv run poe start. In case the GUI is stopped start it by uv run poe gui start. To make sure you can see the changes in the GUI type CTRL + SHIFT + R to hard reload the current page. Otherwise you might load a cached version which does not show your changes.
Testing plugins in the terminal
Checking the modified plugin in the GUI can be time consuming. You can also run the nomad parse command in a terminak on test files and test if it gets processed.
Let's try out a simple example. Create a new file in packages/pdi-nomad-plugin/tests/data/mbe/ and name it test1.archive.json. Paste the following content
{
    "data": {
        "m_def": "pdi_nomad_plugin.mbe.processes.ExperimentMbePDI",
        "name": "test1",
        "datetime": "2025-09-24T17:05:08.083081+00:00",
        "substrate_holder": {},
        "my_quantity": "this is a test"
    },
    "workflow2": {
        "name": "test1"
    }
}
uv run nomad parse packages/pdi-nomad-plugin/tests/data/mbe/test1.archive.json --show-archive > testoutput.archive.json
This is more useful when you work on parsing files and want to test some processing where spinning up the appworker and testing inthe GUI for each little change would be too time consuming.
If you have the nomad-measurment plugin installed you can run the nomad-parse command for example on a XRD file:
TwoTheta_scan_powder..archive.json
We need to run nomad parse again on this archive file and store the output in a new archive.json file to access the processed output:
uv run nomad parse packages/nomad-measurements/tests/data/xrd/TwoTheta_scan_powder.archive.json > test1.archive.json
You can also test the plots of the plugin by using --preview-plots. This is extremely useful to quickly change plots. Run and see the Plotly plots in corresponding browser tabs:
uv run nomad parse packages/nomad-measurements/tests/data/xrd/TwoTheta_scan_powder.archive.json --preview-plots
Please refer to plugins documentation to learn more about running parsers from CLI or within Python. Running the parse command within Python can be used to run automatized tests.
Debugging Plugin Code
Debugging is the process of running your code step by step in order to find problems and understand how it behaves at runtime. Instead of just looking at log files or error messages, a debugger lets you pause execution, inspect variables, and control the flow of your program. This is one of the most effective ways to fix issues in your plugin code and learn how NOMAD processes your changes.
Running NOMAD locally with a debugger allows you to attach directly to the plugin code while it executes. You can then pause execution at specific lines (breakpoints), check variable values, and follow the program’s logic in detail.
Step 1: Enable the Debugger
Open the file .vscode/launch.json in your nomad-distro-dev workspace and add the following configuration:
{
  "name": "appworker",
  "type": "python",
  "request": "launch",
  "justMyCode": false,
  "program": "${workspaceFolder}/.venv/bin/nomad",
  "args": ["admin", "run", "appworker"]
}
Save the file.
Step 2: Set Breakpoints
- Open the plugin file you want to inspect in VS Code.
- Click in the margin (to the left of the line number) where you want execution to pause.
- A red dot will appear, marking your breakpoint.
Step 3: Run NOMAD in Debug Mode
- In VS Code, open the Run and Debug panel (left sidebar).
- Select
appworkerfrom the dropdown menu. - Press the Play button ▶️.
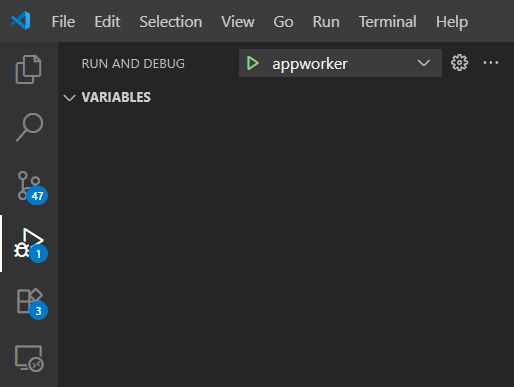
NOMAD will now start in debugging mode.
Step 4: Trigger Your Plugin Code
- Open the NOMAD GUI in your browser.
- Perform the action that uses your plugin (e.g., upload a file, run a calculation, etc.).
- Execution will stop at your breakpoint.
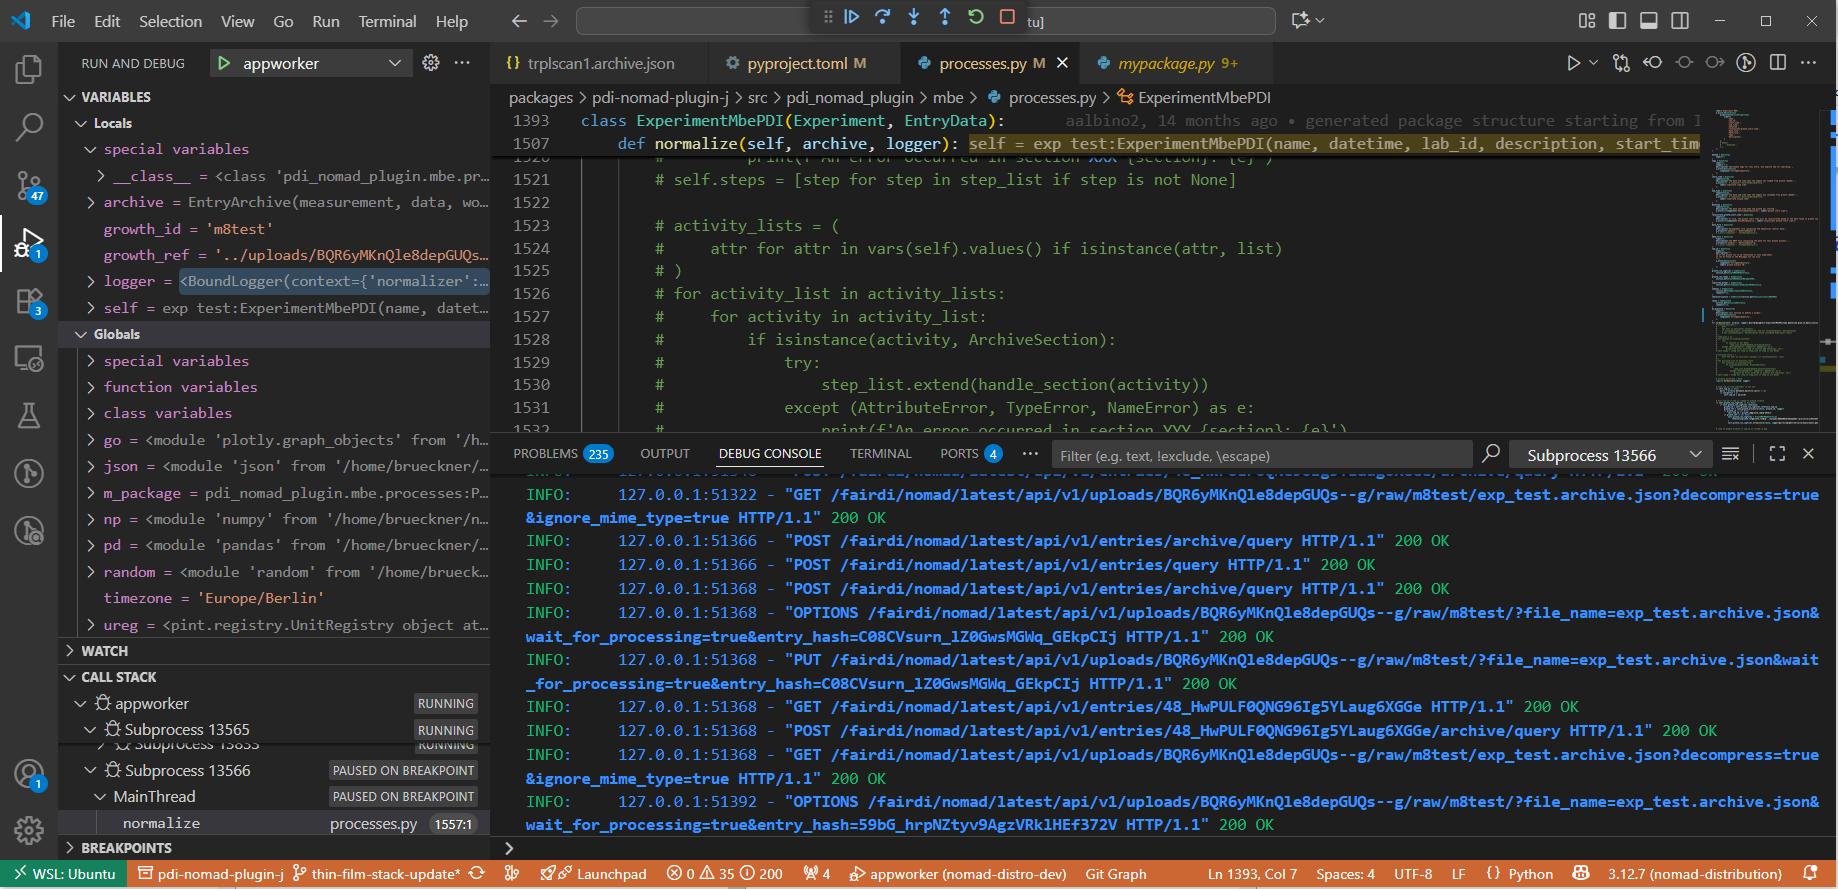
At this point, you can:
- Inspect variable values
- Step through code line by line
- Resume execution with the control buttons
✅ Summary
- Breakpoints stop execution where you want to inspect code
- Debugger shows variable values and program flow
- Run/Debug mode in VS Code makes it easy to understand what your plugin is doing and fix errors more effectively